Mission control for a distributed LLM agent farm. A single-screen dashboard that aggregates state from dozens of local workers across heterogeneous hardware — and lets you act before anything cascades.
"SSH-ing into three terminals and grepping logs is not a control plane."
Running a farm of local LLM workers across multiple Macs sounds straightforward until you try it. Each machine produces its own logs, its own tmux session, its own swap pressure.
A qwen-code TUI sitting at an input prompt. A lite runner skipping 20,000 blocklisted jobs in a row. One machine OOMing because of a runaway feeder. There's no single place to see any of it.
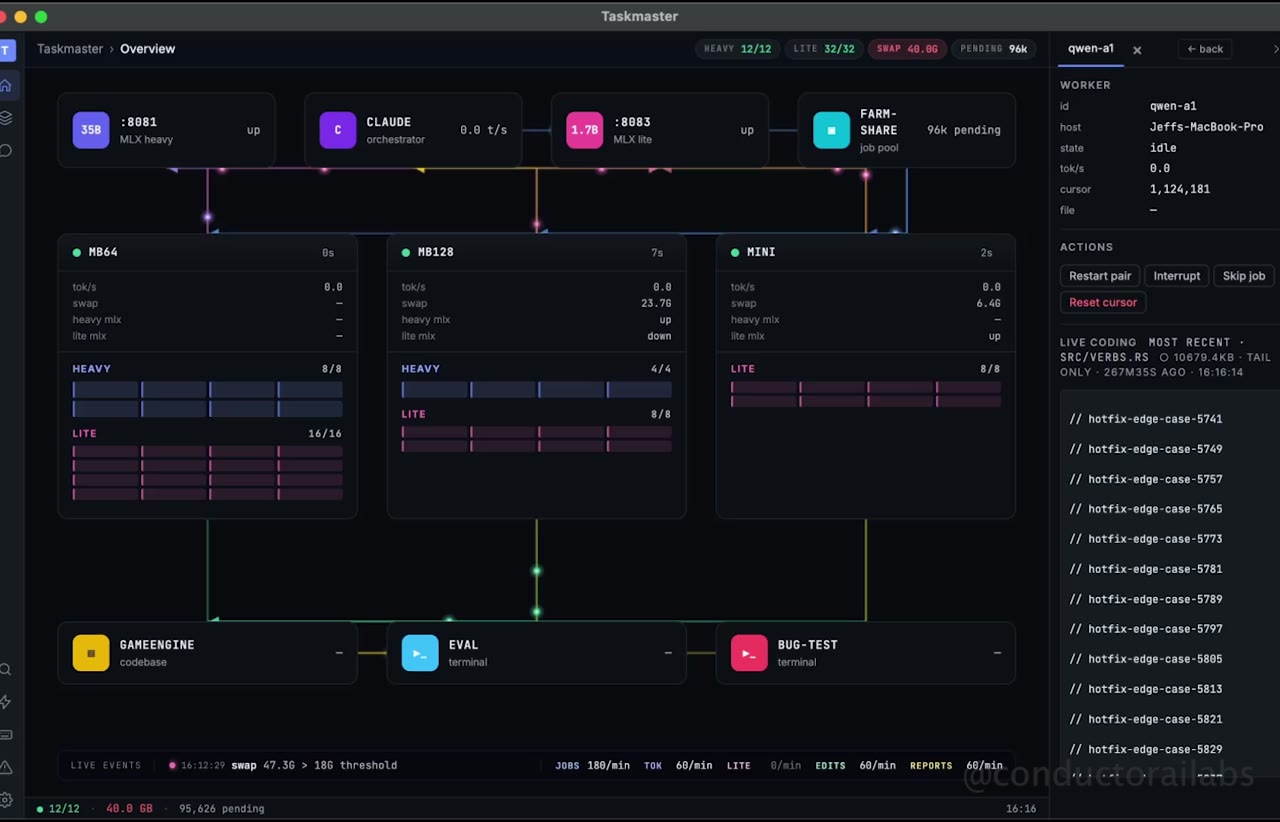
Taskmaster is that single place. An Electron desktop app that aggregates real-time state from every machine in the farm via a shared mount point, visualizes the data flow as an animated topology, surfaces problems before they cascade, and lets you act without leaving the dashboard.
The reference deployment runs on three Macs: a 64 GB MacBook Pro hosting the dashboard, a 128 GB MacBook Pro running four heavy qwen workers and eight lite runners, and a Mac Mini running eight lite runners. The architecture scales to one machine or twenty.
The only requirement is a shared mount point. Add a fourth machine, mount the share, drop in a publisher — it appears in the dashboard the next tick. Zero config.
A bounded broadcast loop in the main process. A vanilla-JS SPA with a Phaser overlay in the renderer. The filesystem as a coordination bus. No frameworks, no bundler, no surprises.
Captures four snapshot families in parallel — farm state, multi-host heartbeats, queue stats, system health — and fans them out to the renderer over Electron IPC. Deliberately throttled to avoid IPC starvation under load.
Three tabs: Overview, Tasks, Chat. Direct ES module imports, no bundler. A Phaser overlay renders the orthogonal flow graph at 60 fps — jobs traveling from orchestrator to worker rack to MLX server to codebase.
Each machine writes farm-share/heartbeats/<host>/heartbeat.json every second. Taskmaster scans the share and folds them into a uniform schema. SMB, NFS, or any mount point will do.
A single shared JSONL is the source of truth for cross-machine discussion. The dashboard tails it, mirrors it in memory, and serves an authoritative HTTP endpoint so any tool can read what the UI is rendering.
The interesting engineering wasn't writing the dashboard — it was keeping it alive while the farm it monitors is throwing 1 M+ queue entries at it.
Naive line-count via createReadStream accumulated GBs of transient strings under GC pressure. Replaced with a 4 MB head-sample + scale-up estimator. ±2% accuracy, bounded memory. Uptime climbed from 26 seconds to indefinite.
File-descriptor exhaustion under load. Multiple fsp.open() paths lacked try/finally. Unclosed FDs caused EBADF on spawn, which escaped Promise executors as unhandled rejections that accumulated until V8 OOM. Wrapped every file read in a guarded helper. Added a global rejection handler with a memory breadcrumb.
IPC backpressure storm. A virtualized job-table fired three fetchPage calls per snapshot, each opening its own stream in main. At 1 Hz that's three concurrent file streams per second — enough to swamp V8's young-generation GC. Coalesced to a single requestAnimationFrame-debounced render, then replaced the virtualized table entirely with on-demand sampled cards.
Phaser canvas pausing on hidden tabs. Tab switches set display: none, killing the ResizeObserver and leaving Phaser's anchor positions stale. Dispatched a taskmaster-tab-active event from the tab switcher and re-pushed anchors on activation.
Steady state: ~50 MB RSS, ~15 MB JS heap, holding indefinitely under a hot farm. The dashboard renders the full topology at 60 fps while the chat ticker types out cross-machine replies in real time.
A control plane that costs more than the workers it manages is a problem, not a tool. Every optimization in Taskmaster is in service of staying small while the fleet stays large.
Steady state under a hot farm doing continuous git activity, 16 active runners, and 1M+ queue entries. Holds indefinitely.
Throttled by design. Four snapshot families captured in parallel, fanned out to the renderer in one IPC round-trip. No starvation under load.
Mount the share. Drop in a heartbeat publisher. It appears in the dashboard on the next tick. Same scheme scales to twenty hosts.
The reference deployment manages an LLM agent farm authoring a game engine. Strip the prompts and the project-specific edges, and the same architecture powers any pipeline where you want to run many concurrent specialized agents — and see all of them at a glance.
One prompt per file. Distributed across N machines, each with its own budget. The dashboard surfaces stuck workers, blocklist drift, and per-host token rates in one screen.
One prompt per issue. Cross-machine chat becomes the coordination primitive — @-mentions route to the right runner, asks-without-replies bubble up as stale.
One prompt per test scenario. Per-runner state, per-machine swap pressure, MLX endpoint health — all visible without leaving the dashboard.
An internal control plane for our own LLM farm — built because nothing off the shelf did the job. The architecture is reusable. The dashboard is the product.